Data Portfolio
Optimising E-Commerce Delivery Logistics
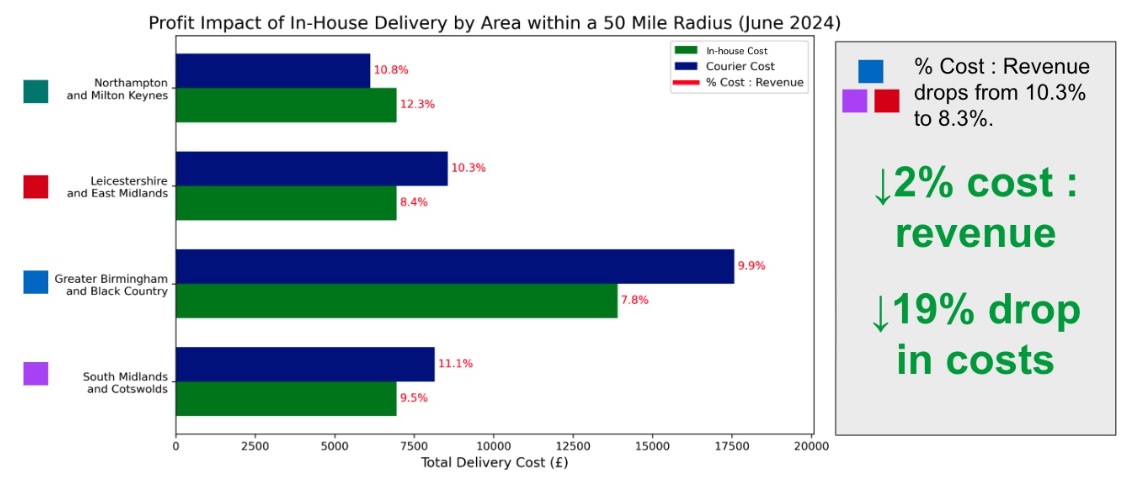
A UK packaging e-commerce retailer sought to enhance profitability by transitioning deliveries within a set radius from third-party couriers to in-house operations. Leading a team of four analysts, I evaluated the impact of in-house delivery on profitability, optimal fleet size, and the most cost-effective delivery freight model. Using Google Distance API and K-means clustering, we analysed customer order density and optimised delivery routes through a Python-based route planner. We identified Greater Birmingham, Leicestershire, and the South Midlands as the most profitable regions for in-house deliveries, estimating monthly cost savings of £6.5k and a 19% reduction in delivery costs compared to courier costs. Recommendations included operating four 7.5-ton LGV vehicles with four drivers on weekday shifts, while retaining third-party couriers as contingency. Transitioning specific routes would enhance profitability and optimise resource utilisation, with an estimated monthly operational cost of £27,800.
Tools: Excel, Tableau, Python, Pandas, Seaborn, Matplotlib, Google Distance API
Read about the full analysis here
Next Best Football Players
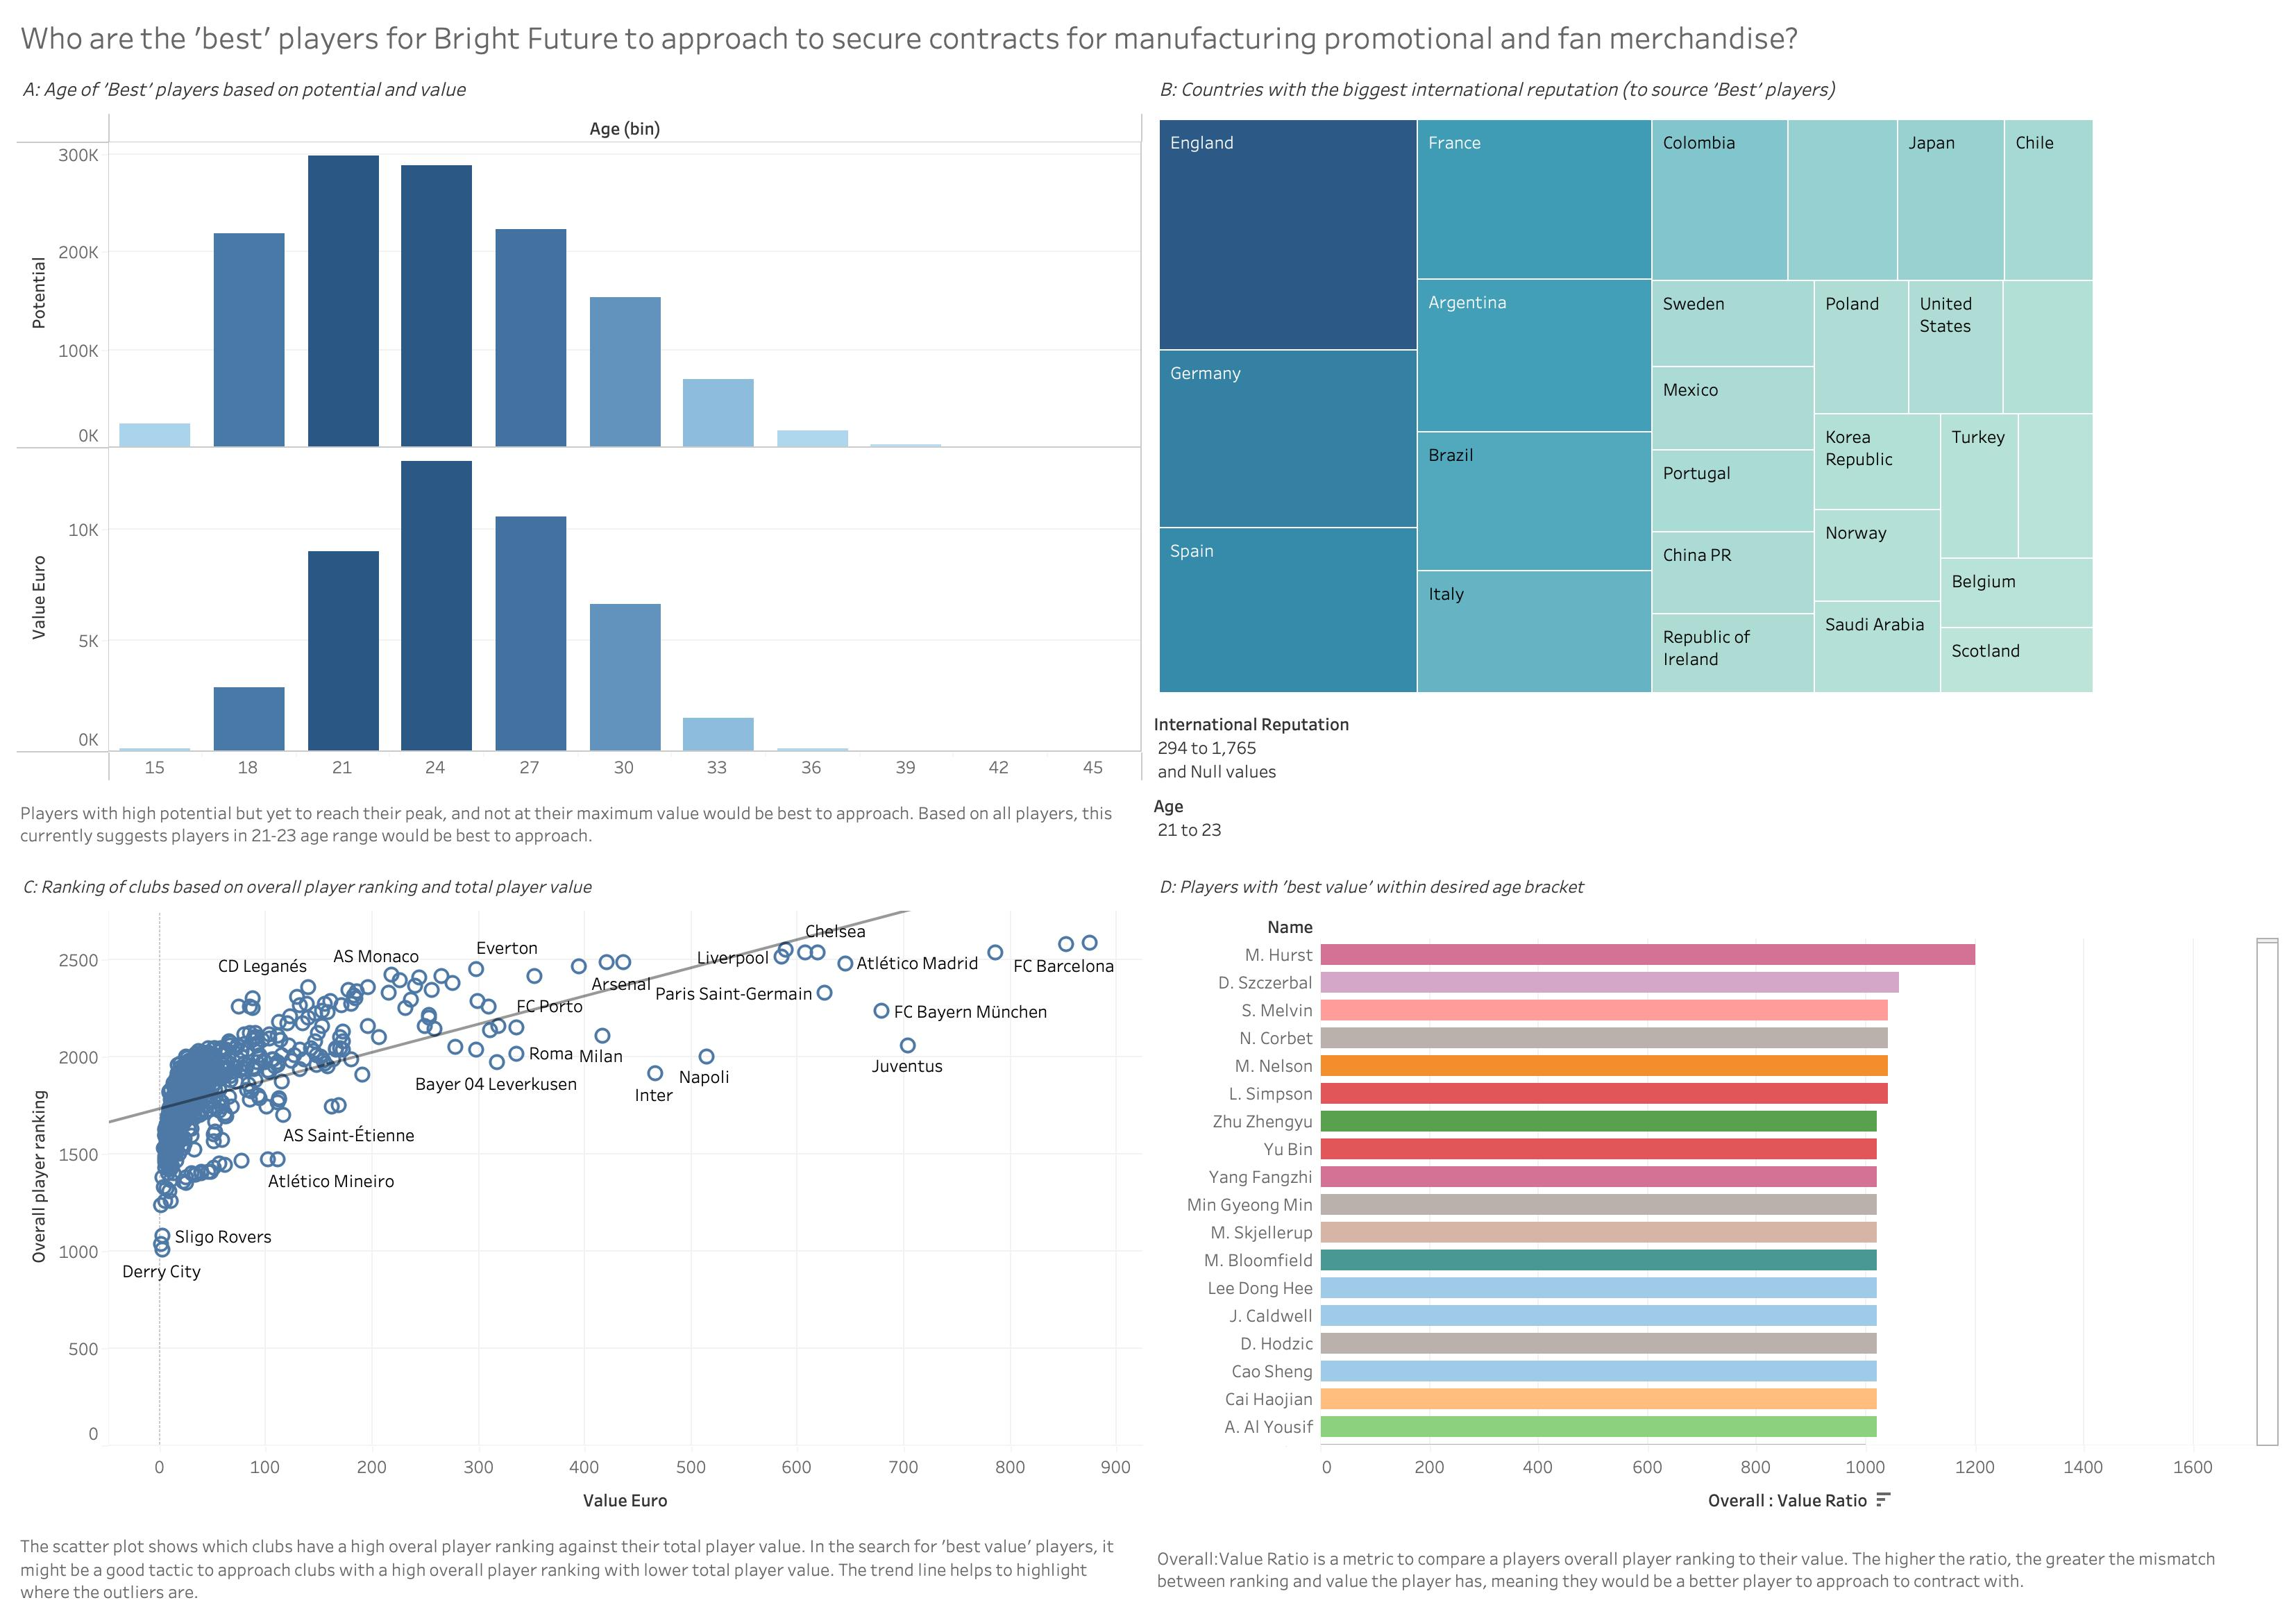
A fictional sports marketing company sought to identify the 'next best' football players for promotional and merchandise opportunities. Using a dataset of 18,000 global players, the data was cleaned in Excel, merged in Tableau, and an interactive dashboard was created. The dashboard featured a 'good value' metric and filters for age, country, and club, allowing the client to search for top players meeting specific criteria. This tool enabled stakeholders to select a targeted list of players who fit the desired profile for marketing purposes.
Tools: Excel, SQL, Tableau
View the Tableau Visualisation
Supermarket consumer behaviour
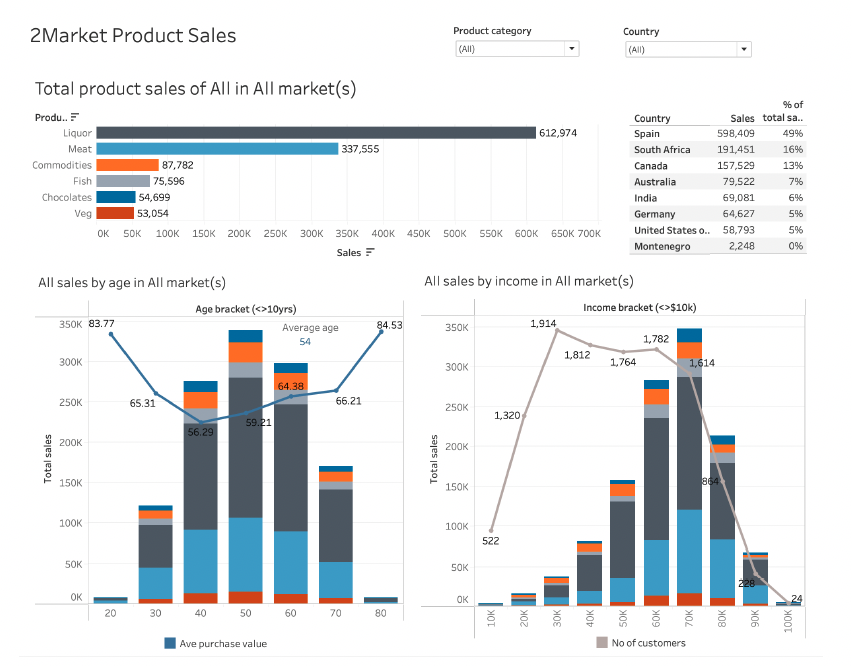
A global supermarket chain sought to identify the key customer demographics, products, and advertising channels to prioritise in their next marketing campaign to maximise operating profit. I focused on increasing sales and reducing costs to improve net profitability. After cleaning two datasets, I conducted exploratory data analysis in SQL and created three Tableau dashboards highlighting product sales, customer behaviour, and advertising effectiveness. Key insights included focusing on top-selling countries (Spain, South Africa, Canada), high-income customers without children, and using Instagram, Facebook, and Twitter for advertising. Further recommendations included exploring strategies to boost sales in lower-income segments and reassessing the effectiveness of brochures.
Tools: Excel, SQL, Tableau
View the Tableau Visualisation
NHS Missed Appointments
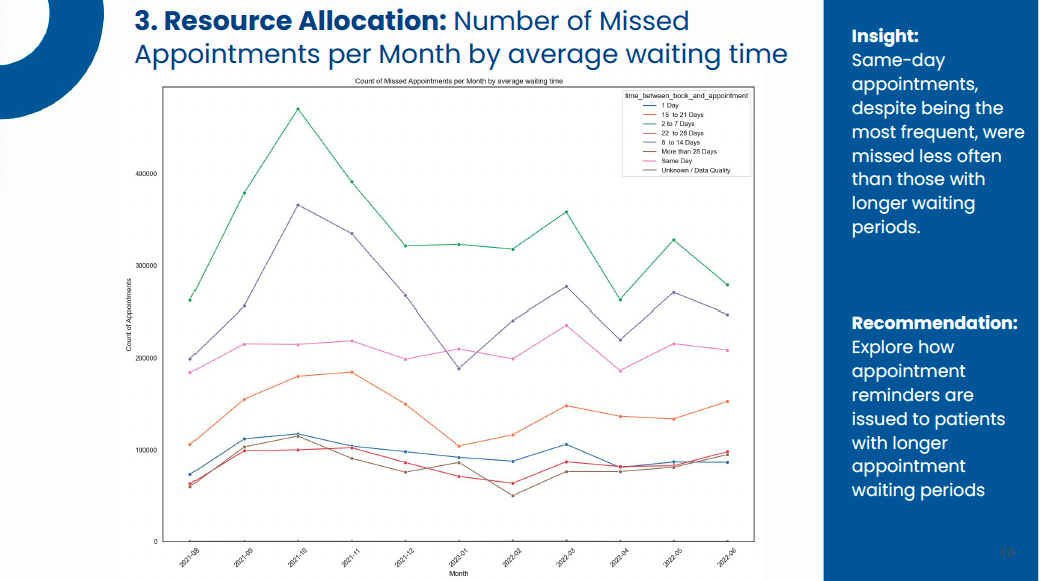
Through a data-driven analysis of 740 million appointments over 18 months, the NHS aimed to understand missed GP appointments and resource utilisation. Using Python for exploratory analysis and visualisation, I examined resource capacity, staffing, and trends in X (formerly Twitter) engagement. Key insights revealed that missed appointments were not due to capacity issues, same-day appointments were missed less often than those with longer waiting periods, and telephone appointments had a lower no-show rate compared to face-to-face visits. Recommendations included increasing telephone and online appointments, improving reminders for longer waiting periods, and enhancing X engagement by leveraging popular healthcare hashtags like #ai. Read more about this project here.
Tools: Python, Pandas, Numpy, Seaborn, Matplotlib
View the GitHub Repository
Customer Clustering
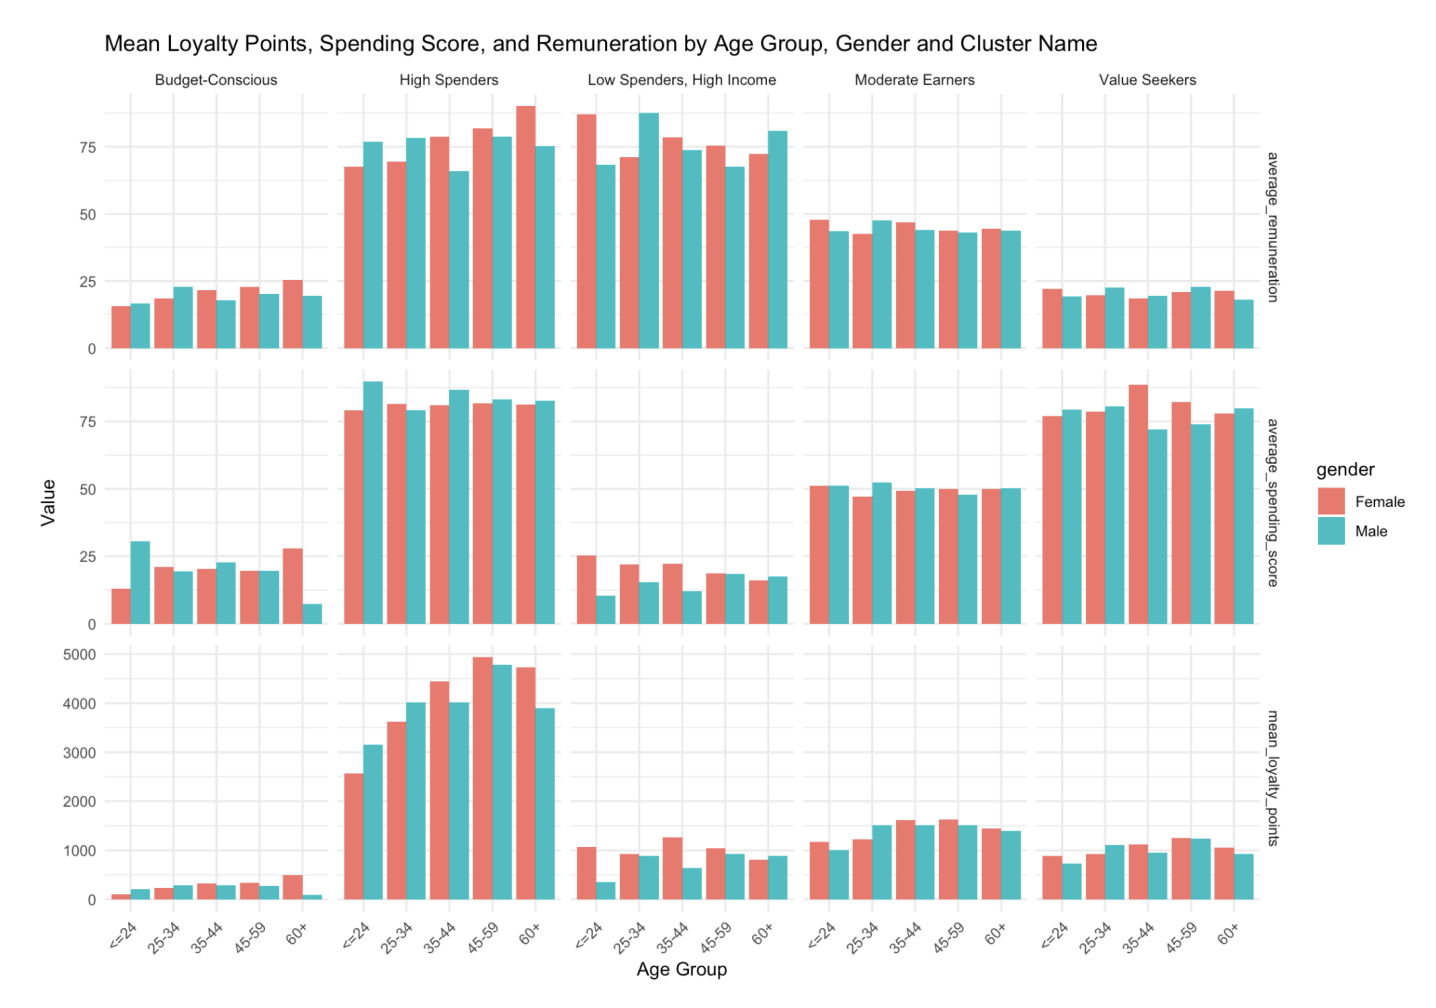
A global games manufacturer sought to boost sales by improving their understanding of customer behaviour, loyalty programs, and product reviews. Focusing on key questions about what drives loyalty points, I conducted analyses including Linear Regression, K-means clustering, and sentiment analysis. Insights revealed that Turtle Games should align marketing strategies to target high spenders, adjust product strategies for lower-spend customers to encourage growth, and use regression models to predict loyalty points, explaining 84% of the variability. Recommendations included deeper analysis of product data and refining models with larger datasets for improved accuracy.
Tools: Python, R, Pandas, Numpy, Seaborn, Matplotlib, sklearn, nltk, dplyr, ggplot2
View the GitHub Repository
